Project 6: Your own dashboard
**Goal:** one page with your steps, sleep, resting heart rate and HRV over the last months, every device together, and a training chart on it that you added yourself.
Goal: one page with your steps, sleep, resting heart rate and HRV over the last months, every device together, and a training chart on it that you added yourself.
Time: 20 minutes. Level: some Python. Needs: project 1.
1. Make the page
python3 recipes/dashboard.pywrote health-dashboard.html: open it in a browser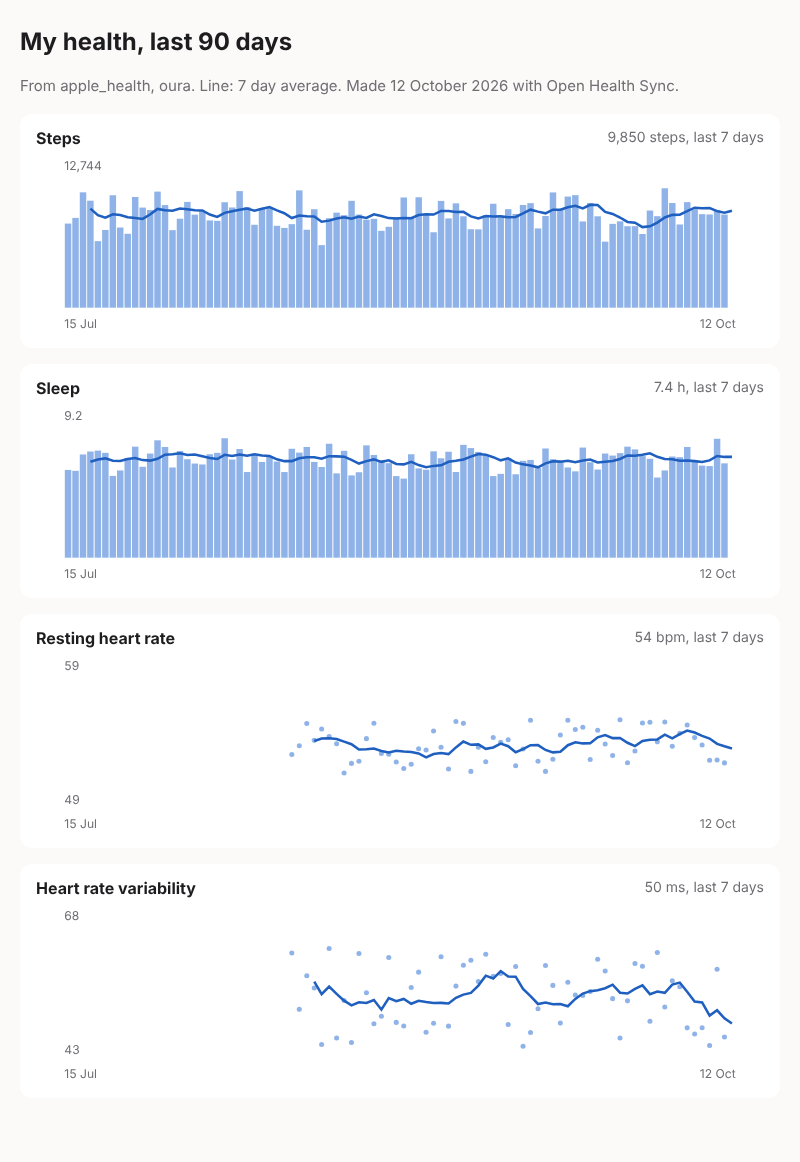
It is a single HTML file, with no script and nothing loaded from the internet. Bars and dots are days, the line is the 7 day average, and hovering a day shows its value. It follows your light or dark mode.
2. Add a training chart
Make your own copy first, so an update of the repository never overwrites your changes:
cp recipes/dashboard.py my-dashboard.pyOpen my-dashboard.py and find def main():. Just above the line that starts with
apps = sorted(, add the minutes of training per day:
    training = defaultdict(float)
    for w in records("workouts", start=start.isoformat()):
        training[date.fromisoformat(w["start_date"][:10])] += (w["duration_s"] or 0) / 60
Then add one line to the list of charts, after the heart rate variability one:
chart("Training", "min", training, start, a.days, True, "{:.0f}"),python3 my-dashboard.py --days 60Open health-dashboard.html again: a fifth chart shows your training as daily bars, under the
four others. The chart() function does the drawing; you only gave it a name, a unit, a value
per day and True for bars (False draws dots).
Make it yours
- Another daily figure.
kcal, _ = daily("active_kcal", start)gives a value per day from the app that reports it most, ready forchart();readiness_scoreandrecovery_scorework the same for a ring or a band. The fields are listed under DailySummary. - A year.
--days 365 --out year.htmlis a good page to look at in January. - Every morning. Run it from cron and write the file into a folder your home server publishes, so the page on your phone is always today's.
The file holds your health data: share a screenshot rather than the page itself, or crop the numbers out.
Share it
A screenshot of your dashboard, or just of the chart you added, in Show and tell.
Project 5: Does training cost you sleep?
**Goal:** a script of your own that puts two lists side by side, your workouts and your nights, and answers a question your apps answer separately: do you sleep less after a hard day?
Project 7: A message when your night syncs
**Goal:** a small server of your own that Open Health Sync calls the moment new sleep arrives, and that writes you one line about last night.