Dashboard
One page with your steps, sleep, resting heart rate and HRV over the last three months, every device together.
One page with your steps, sleep, resting heart rate and HRV over the last three months, every device together. It is a single HTML file with no script and nothing loaded from the internet: open it, keep it, print it.
python3 recipes/dashboard.py                    # last 90 days, writes health-dashboard.html
python3 recipes/dashboard.py --days 365 --out year.html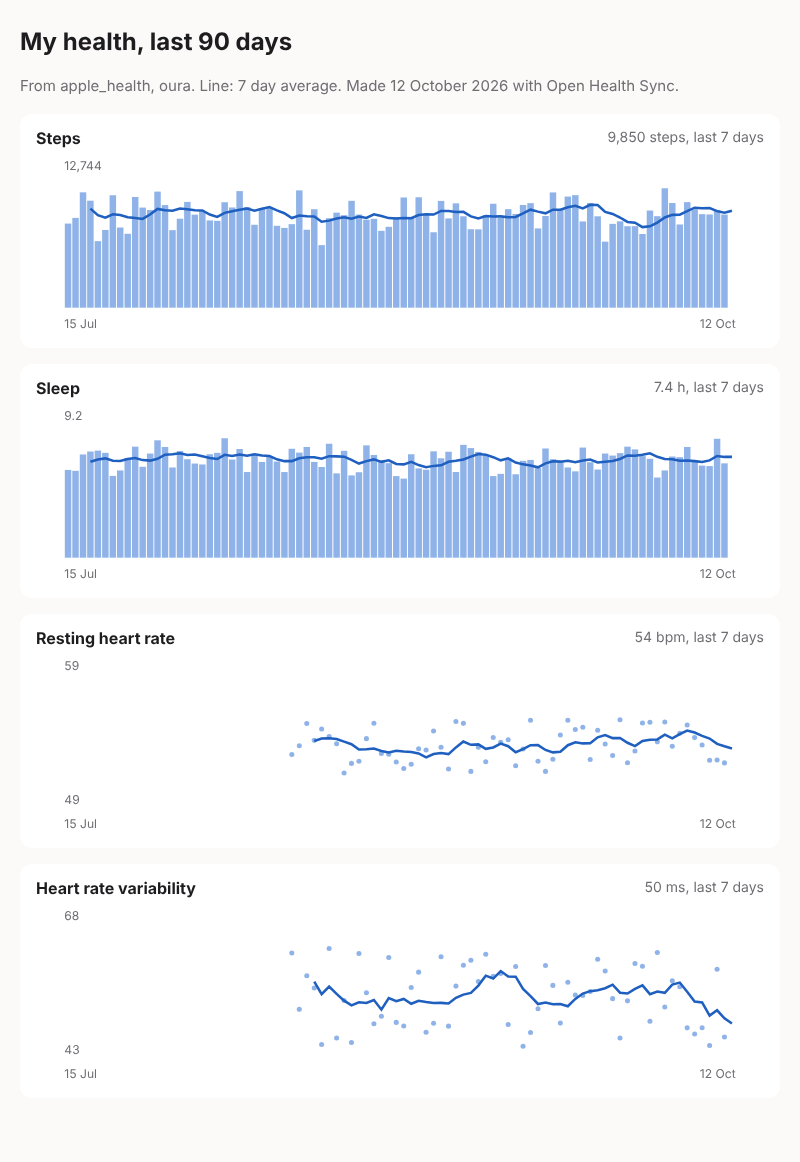
Bars and dots are days; the line is the 7 day average. Hover a day for its value. The page follows your system's light or dark mode.
The file holds your health data. Share it with care.
How it works
It reads GET /v1/users/{id}/daily (steps, resting heart rate, HRV) and
GET /v1/users/{id}/sleep, picks for each chart the source that reports it on the most days,
and draws the charts as inline SVG in Python, with no library.
Make it yours
- Add a chart: copy one
chart(...)line and give it another daily field, such asactive_kcal. - Serve it: write the file into a folder your home server publishes, from cron each morning.