A glucose average can hide what the pattern shows
A study of 90,757 people wearing glucose monitors found that the shape of glucose over the day, not just its level, set prediabetes and diabetes apart and flagged risk that a standard target missed.
Soma Labs3 min read
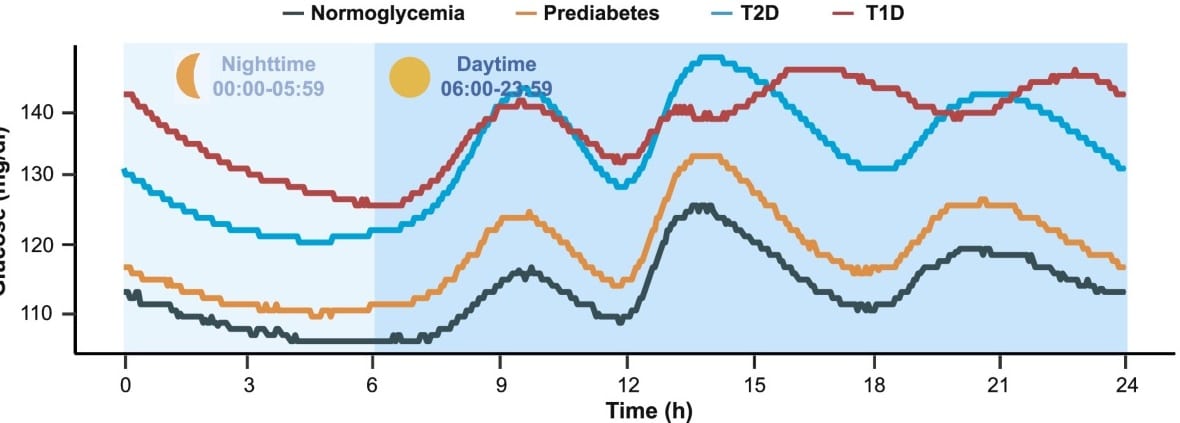
Continuous glucose monitors record a reading every few minutes, day and night. Yet most of what people see from them is boiled down to a few numbers, like an average or the share of time spent in a target range. A study published on October 13 in npj Digital Medicine asks how much is lost in that summary.
The researchers, from Central South University in Changsha, China, analyzed data from the iCanNet cohort, 90,757 people who wore glucose monitors. They looked at people with normal glucose, prediabetes, type 2 diabetes and type 1 diabetes.
48 ways to describe a day
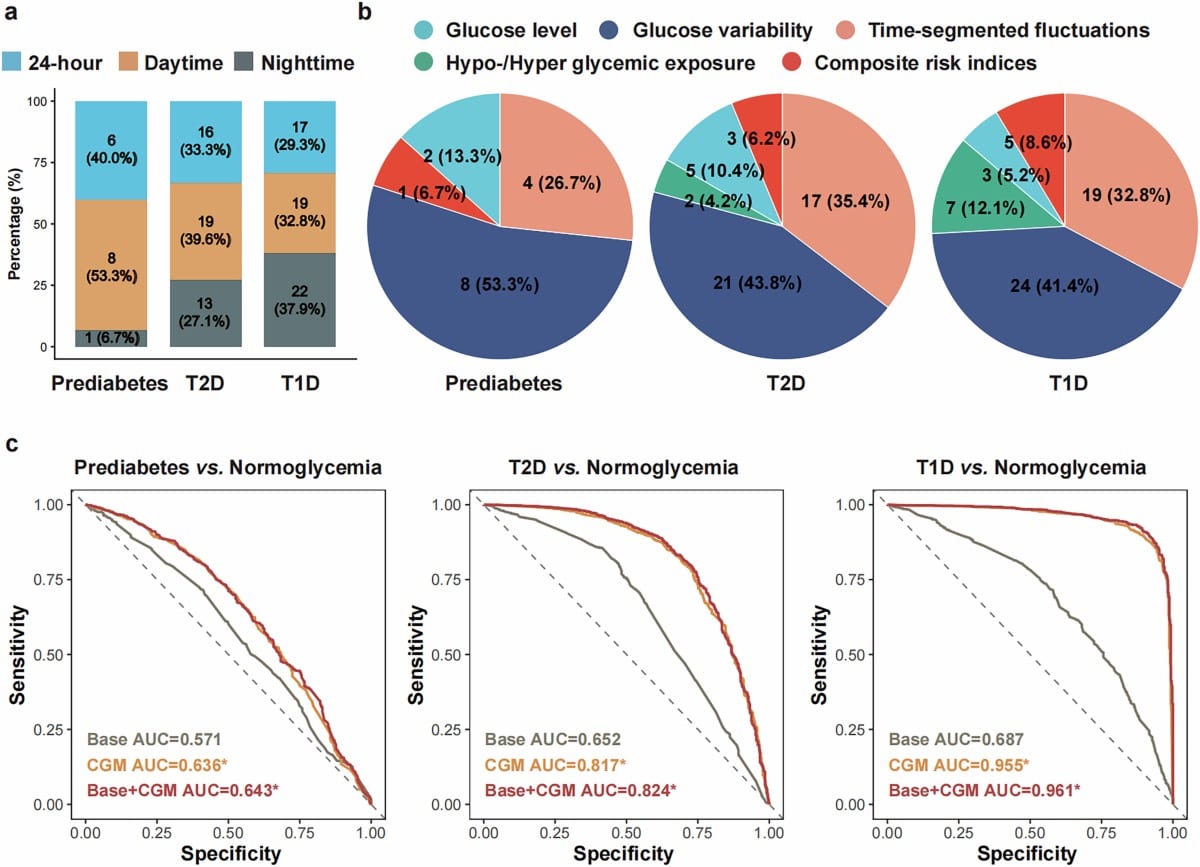
Instead of one or two summary numbers, the team computed 48 metrics from each person's glucose trace. Some described the level, others how much it swung, when the swings happened, and how much time was spent too high or too low. They also split the day into night and daytime.
The average curves already show the idea. Each group had its own daily shape, not just a higher or lower line.
The paper reports that people with prediabetes, type 2 diabetes and type 1 diabetes each had distinct glucose signatures compared with people with normal glucose. Combining the five most informative metrics improved how well the groups could be told apart, and the predicted risks matched the observed ones.
Four patterns in type 2 diabetes
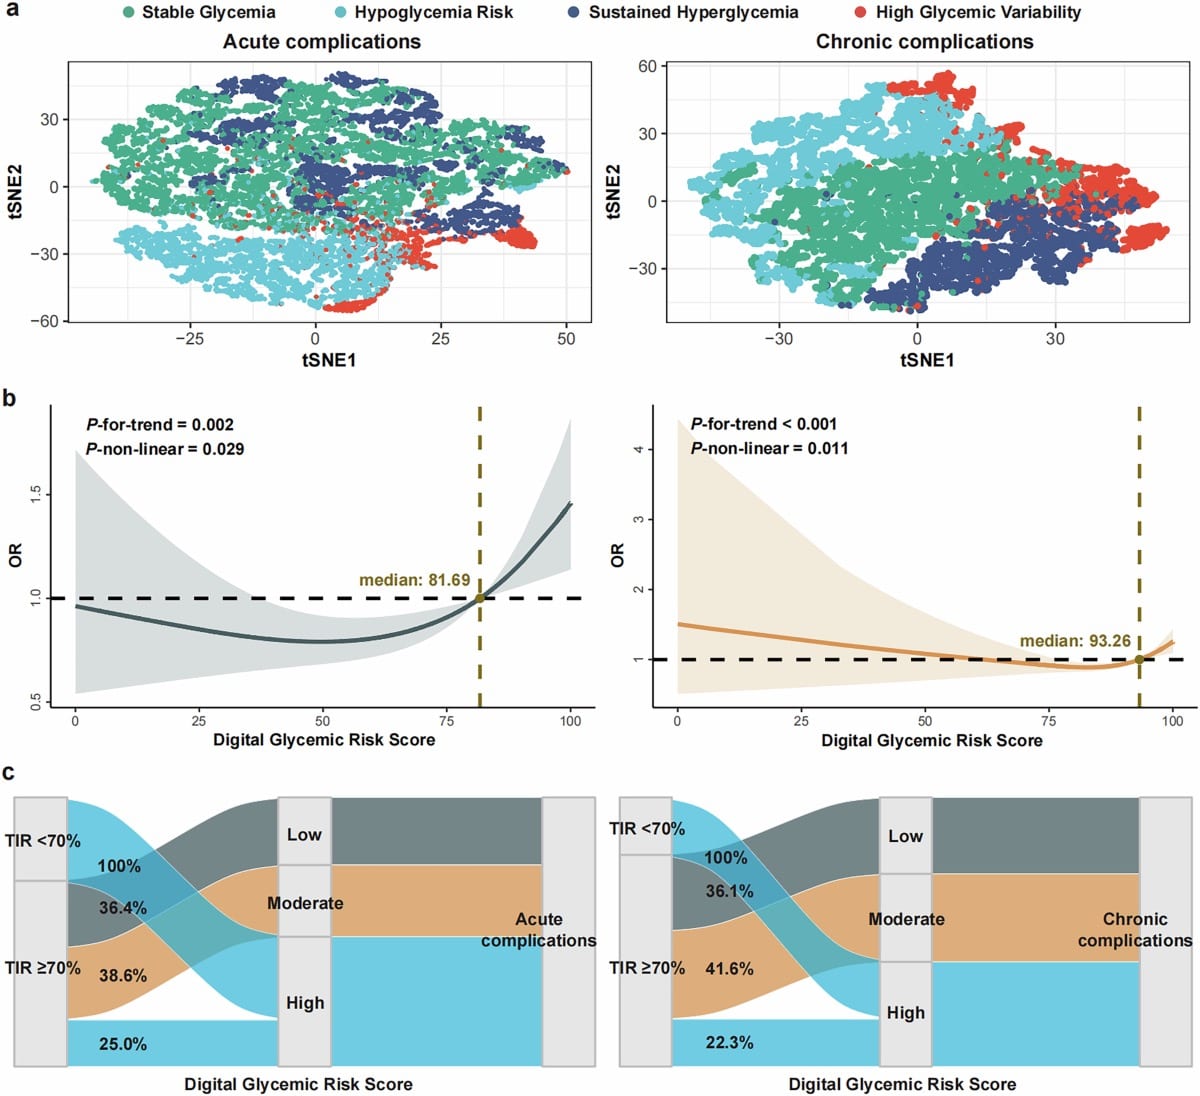
Among people with type 2 diabetes, the researchers grouped glucose traces into four patterns. Compared with the rest, a pattern of sustained high glucose was associated with a 59% higher risk of acute complications. A pattern of high variability was associated with a 75% higher risk of acute complications and a 41% higher risk of chronic ones.
They then built what they call a digital glycemic risk score. Its most striking result concerns people who already met the common target of spending at least 70% of the time in range. The score moved 25.0% of them into a high-risk group for acute complications, and 22.3% for chronic complications.
What it does and doesn't show
This is an association study in one large cohort in China. It doesn't show that changing a glucose pattern changes the risk, and the score isn't a clinical tool anyone can use today. Anyone managing diabetes should keep working from their clinician's targets. What the study does show is that the same average, or the same time in range, can sit on top of quite different days.
Where Soma fits
The point we take from this goes beyond glucose. A single summary number is easy to read, and it can hide the pattern that matters. How a measure moves, and when, often says more than where it sits on average.
Soma doesn't measure glucose, and it doesn't diagnose. Soma Axon, which we're still building, is a closed pod you'll visit once a week, with the same light, cameras and stance each time. Our aim is a consistent record of how your own measures change from week to week, each with its margin of error shown, rather than one number on one day. The same instrument, every week explains the idea.
Sources, as of October 13, 2026: Lu, Ding, Zhao, Fang, Lu, Huang and colleagues, Multidimensional continuous glucose monitoring metrics enable digital risk stratification across the diabetes spectrum, npj Digital Medicine (October 13, 2026), open access under CC BY 4.0. This post describes research and isn't medical advice.